
Ecommerce continues its rapid expansion, projected to reach $6.8 trillion by 2028 and capture nearly a quarter of the global retail market. While the growth is enticing, the rising tide of online sales brings with it a significant challenge: returns.
For high-growth sellers, managing returns is no longer just an operational cost but a strategic imperative that directly impacts profitability, cash flow, and even marketplace visibility.
Drawing insights from Storfund’s analysis of 54 million orders across major markets (France, Germany, Italy, Spain, the UK, and the US) from January 2023 to December 2024, this article explores key trends in return behavior and offers actionable implications for sellers.
Return Rates: A Country-by-Country Comparison
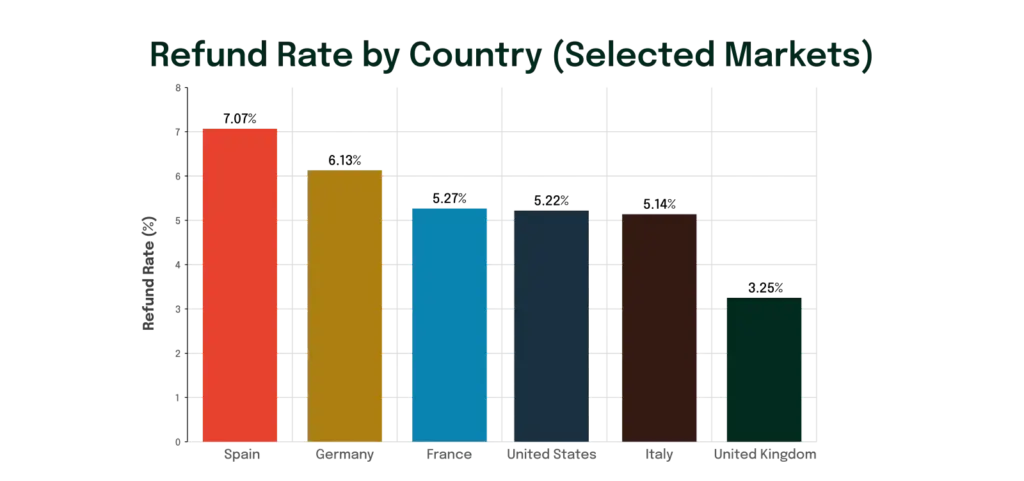
Return rates vary significantly by country, reflecting diverse consumer behaviors and expectations.
Key Insights:
- UK leads with the lowest return rate: At 3.25%, UK shoppers return the fewest items.
- Spain and Germany show the highest rates: Spain tops the chart at 7.07%, more than double the UK figure, while Germany’s rate stands at 6.13%.
- Average Return Rate: The average across all six countries is 5.35%.
Implications for Sellers:
- Tailor logistics and cash flow: In high-return markets like Spain and Germany, plan for increased reverse logistics and potential restocking delays. Strengthen cash flow to offset refund delays.
- Strategic product launches: Leverage low-return markets like the UK to test higher-value SKUs or new product lines.
- Inventory allocation: Adjust inventory forecasting and allocation by country to protect margins and improve operational resilience.
Year-on-Year Shifts in Return Behavior (2023 vs. 2024)
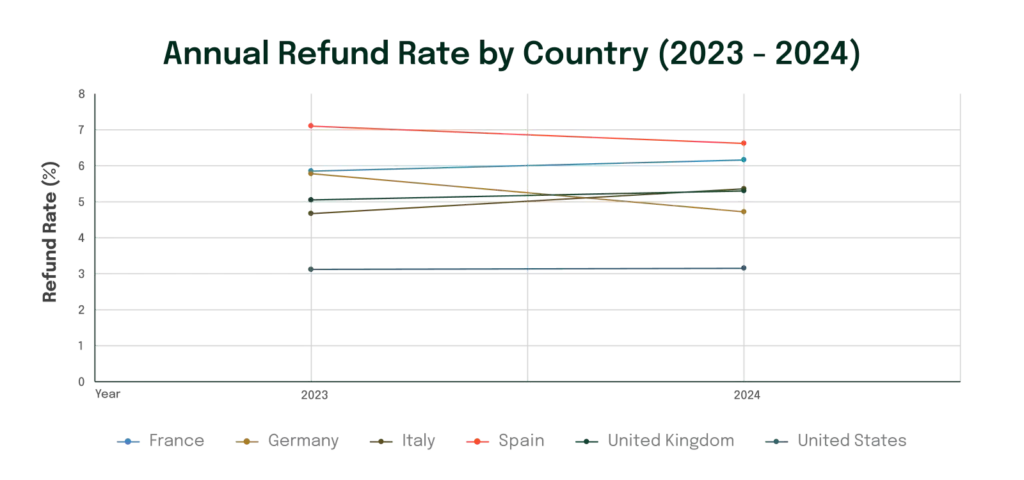
Analyzing monthly refund rates reveals evolving consumer behaviors and market dynamics.
Improving Markets:
- France and Spain: Both countries show meaningful declines in return rates despite rising order volumes. France decreased from 5.90% to 4.70%, and Spain from 7.11% to 6.62%. This could indicate improvements in product selection or customer satisfaction.
Slight Upticks:
- Italy: Increased from 4.68% to 5.42%.
- Germany: Rose from 5.77% to 6.18%, maintaining one of the highest rates.
- US: Nudged upward from 5.06% to 5.21%.
Stable Performer:
- UK: Remains the lowest-return market, holding steady with a slight increase from 3.13% to 3.22%, reinforcing consistent shopper behavior.
Implications for Sellers:
- Proactive adjustments: Act early in markets where return rates are climbing. Reassess product fit, listing clarity, and delivery accuracy in Italy, Germany, and the US.
- Reinforce success: Double down on strategies that are working in improving markets like France and Spain.
- Continuous monitoring: Treat return data as dynamic. Regularly adjust return planning to align with live market signals.
Day-of-Week Patterns in Return Behavior
The day an order is purchased can surprisingly influence return likelihood.
| Country | Highest Return Day | Lowest Return Day | Spread (High-Low) |
|---|---|---|---|
| UK | Tuesday (3.33%) | Saturday/Sunday (2.71%) | 0.59% |
| USA | Monday/Tuesday (5.32%) | Sunday (4.5%) | 0.82% |
| Italy | Monday (5.48%) | Saturday (4.17%) | 1.31% |
| France | Tuesday (5.31%) | Saturday (4.21%) | 1.10% |
| Spain | Friday (7.08%) | Sunday (6.27%) | 0.81% |
| Germany | Tuesday (5.70%) | Sunday (5.51%) | 0.19% |
Key Insights:
- Weekend Wisdom: Across all six markets, return rates are lowest for items purchased on Saturdays and Sundays, suggesting more deliberate buying.
- Early Week = Higher Risk: Orders placed Monday through Wednesday generally show higher return rates, potentially due to impulsive buying or early-week decision fatigue. Spain is an exception, peaking on Fridays.
- Germany’s Consistency: Germany shows remarkably steady return behavior across all days.
Implications for Sellers:
- Strategic promotions: Be cautious with early-week flash sales that may drive higher return rates. Consider scheduling key campaigns later in the week.
- Post-purchase engagement: Use Monday-Wednesday windows to provide helpful content (e.g., sizing guides, usage tips) to reduce returns.
- Optimize weekend fulfillment: Capitalize on lower weekend return rates to trial premium products or bundles.
Monthly Trends in Orders and Refunds
Analyzing return and refund processing by month reveals crucial insights for managing cash flow and operations.
Key Insights:
- Refund Timing Consistency: Across almost all countries, refunds are most often processed at month-end, indicating a shared operational pressure point.
- Order Timing Variation:
- UK and France: Highest refund rates for early-month orders.
- Germany: Peaks mid-month.
- US: Stands out with a late-month spike in both returns and refund processing, creating significant operational pressure.
Implications for Sellers:
- Cash Flow Sensitivity: Refund surges erode liquidity just as sales spikes settle. January and August are global refund pressure points, often showing 2x higher volume than baseline months due to post-holiday and summer sales.
- Geographic Risk Windows: Germany, the US, and the UK face the highest absolute refund volumes, requiring strong cash buffers. Italy and Spain have sharper, more concentrated spikes.
- Inventory and Restocking Lag: High-value SKUs may be tied up in return pipelines during high-conversion periods, delaying reactivation.
- Planning Recommendations:
- Forecast revenue post-refunds, incorporating return rate forecasts into sales expectations.
- Consider real-time cash flow solutions to protect growth momentum during refund-heavy periods.
- Stagger major promotional campaigns to avoid running them across all high-return markets simultaneously.
Price Influence on Return Rates
A clear and consistent trend emerges: as price increases, so does the likelihood of a return.
| Country | Peak Refund Rate (%) | Peak Price Band | Tipping Point Band (first > 9.5%) |
|---|---|---|---|
| France | 11.19 | £170-179.99 | £130-139.99 |
| Germany | 14.62 | £170-179.99 | £50-59.99 |
| Italy | 8.16 | £170-179.99 | N/A |
| Spain | 13.14 | £50-59.99 | £30-39.99 |
| United Kingdom | 12.97 | £170-179.99 | £140-149.99 |
| United States | 24.55 | £130-139.99 | £30-39.99 |
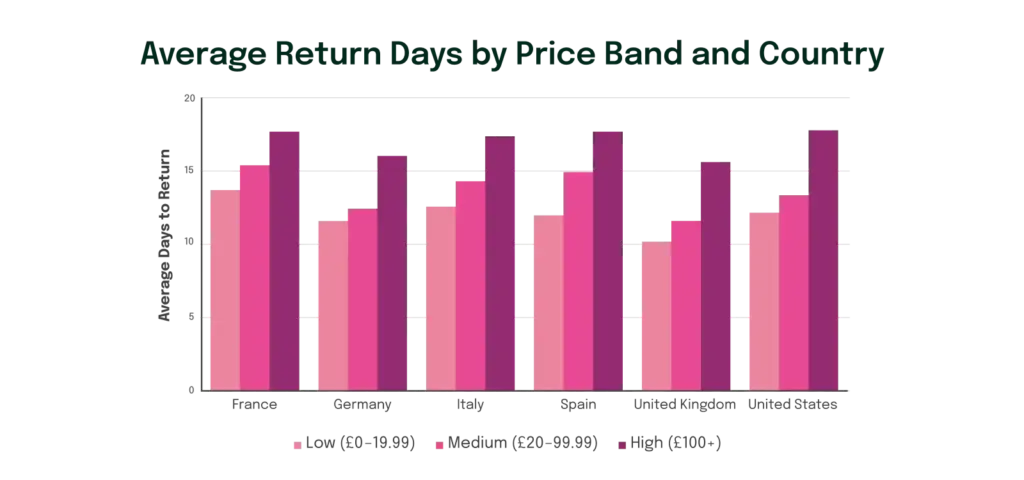
Moreover, the higher the price of an item, the longer it takes for it to be returned.
Key Insights:
- General Trend: Across all markets, higher-priced items have higher return rates.
- Italy’s Stability: Italy is the only market where no price band exceeds 9.5%, indicating a stable return environment.
- Early Surges: Germany, Spain, and the United States show much earlier and more dramatic surges in return rates as prices increase. For example, the US surges to 12.4% at just £30-39.99, and peaks at a staggering 24.6%.
Implications for Sellers:
- Expect delayed cash reconciliation: High-value items take longer to return (average 17-18 days vs. 11-13 days for low-value goods), tying up funds.
- Unlock revenue: Access to real-time cash flow can help absorb refund lag for high-ticket items.
- Time-sensitive resale: High-priced returns may arrive after demand peaks, increasing markdowns.
- Streamline reverse logistics: Prioritize triage and re-merchandising to protect margin.
In conclusion
Returns aren’t just a cost to control — they are a lens into consumer intent, regional maturity, and the operational realities of global ecommerce.
The sellers who treat returns as a strategic input — not just a reactive function — are the ones who will move fastest, invest smartest, and retain the most margin.
Across borders and price tiers, the data tells a clear story: return trends shape visibility, cash flow, and profitability. And those trends can be forecast, managed, and optimised if examined closely.
Global marketplaces offer scale — but the fine print is written in returns.